
Weekly index
The whole tracked catalogue is read once a week, on Monday, so every niche is measured in the same window and the figures are comparable across the tree.
Category Insights is Marzi's weekly index of Allegro. Revenue, buyers, sellers, median price and competition for every category and niche — from the department down to the leaf where the money actually sits.

One wrong niche is a pallet that sells at cost. Category Insights is the number before the purchase order: how much the niche turns over, how many sellers share it, what the median price leaves after Allegro’s fee and delivery. Read the neighbours too — the branch next door is often bigger and less crowded than the one everyone enters.
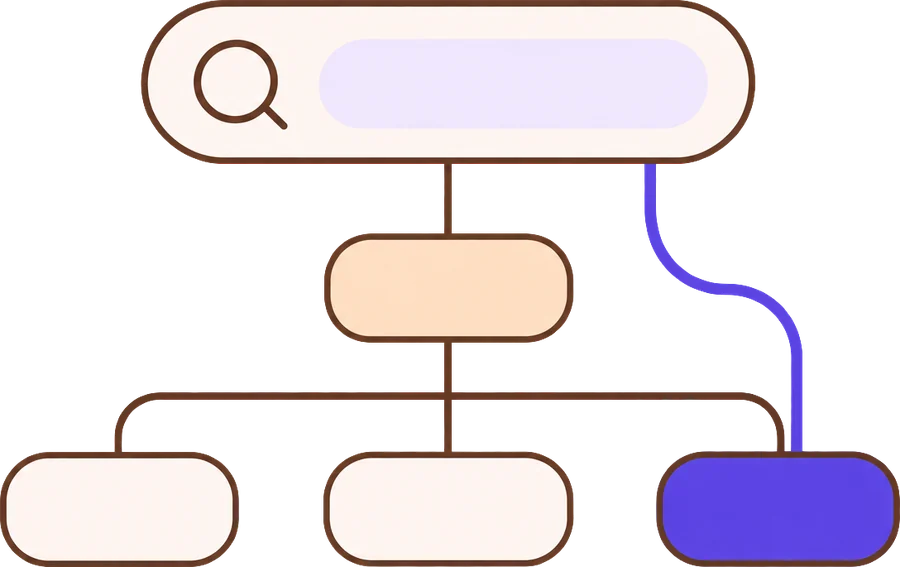
Type a few letters and pick from the suggestions — the branch opens and the page glides to the row. Or start from a department and walk down. Ten thousand niches, sorted by revenue, with the path shown in full so a leaf is never confused with its parent.
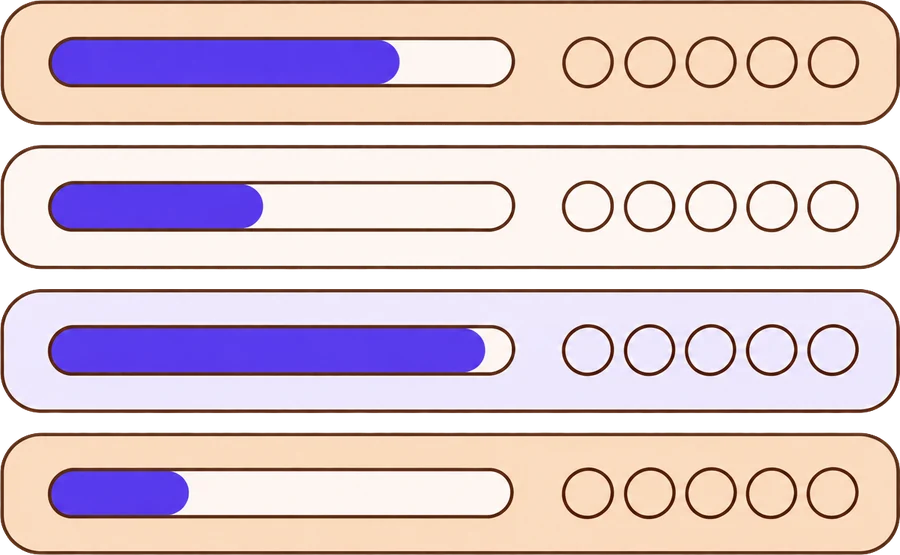
Every row carries the same five figures, measured the same way, so two niches are comparable at a glance. Revenue is the buyers Allegro shows times the median price of a selling product; units are the buyers; competition is a 0–100 index measured from the listing.
Seller counts are the number most tools get wrong. A niche row says how its count was obtained — ✓ counted exactly, ≈ measured on a sample, ~ modelled — and a branch row shows the distinct sellers seen anywhere in it, never the sum of its niches.

Every figure on the screen has the page it was taken from and the method printed next to it. These are the parts.
The whole tracked catalogue is read once a week, on Monday, so every niche is measured in the same window and the figures are comparable across the tree.
Revenue is buyers times the median price of a selling product in the niche, not the price of whatever product card was caught — a parked 3× price does not move the total.
One seller appears in seven niches on average. Marzi counts distinct sellers per branch and never sums them, so the totals stay honest.
One 0–100 number from three percentiles — the offer queue on the cards that carry the revenue, the reviews needed to reach the top ten, the paid share of the first screen — with the same thresholds everywhere.
Every niche count says how it was obtained: ✓ exact, ≈ sampled, ~ modelled. A figure that had to be estimated is never dressed as a count.
Category names come in both languages; prices in euros at the ECB rate or in złoty. One switch in the cabinet changes everything.
Marzi says which is which on the screen itself. Here is the short version for Category Insights.
Size a niche before buying stock: how much it turns over, how many sellers share it, what the median price leaves for margin.
Read your own categories against their neighbours — which branch next door is bigger, cheaper, or less crowded than the one you live in.
Read a whole department the way the market reads it: the size of every branch, the distinct sellers in it, and where the competition index runs high.
From Allegro’s public pages. Every week Marzi reads the listings of every tracked niche — offers, sellers, prices and the buyers counter Allegro prints on product cards — and aggregates them into the index. Nothing is bought from third parties.
Once a week. The full pass starts on Monday and the cabinet switches to the new figures when the whole tree is done, so every niche you compare was measured in the same window.
Allegro shows how many people bought a product in the last 30 days, not how many units or at what price. Marzi multiplies that counter by the median price of a selling product in the niche. It is directional, and the cabinet labels it as such.
It averages three percentiles across the whole index: the offer queue on the cards that carry the niche’s revenue, the reviews needed to reach the top ten, and the paid share of the first screen. Below 40 is low, above 60 is high — the same thresholds in every niche.
How the count was obtained: ✓ counted exactly, ≈ measured on a sample of the listing, ~ modelled from what could be read. Branch rows show distinct sellers seen anywhere in the branch — not the sum of its niches, since one seller works in about seven of them.
Because the buyers counter is a rolling 30-day window. Comparing two passes closer than 21 days apart measures overlapping windows, not change. Trend columns switch on per niche once the history is long enough — the cabinet says so, with the numbers, instead of drawing a line it cannot back up.
Category-level figures are the free layer of Marzi; product- and seller-level detail, history and monitoring are paid. Every new account starts with a 14-day trial of everything, no card required.
7 days, no card required. The whole index, your trackers and the MCP endpoint are live from your first sign-in.