
Competition index
The average of three percentiles — offer queue, review strength, paid shelf — with the same 40/60 thresholds in every niche. One number, one meaning, across the product.
Market Intelligence compares every indexed niche on five signals of competition: the queue of offers, the pressure of paid placements, the review strength of the head, how much the top sellers hold — and the one score that combines them.

In a niche where the top of the listing is ×13 more paid than the rest, an organic newcomer pays for every impression. Market Intelligence shows that before the campaign — and points to the niches where the shelf is still organic and a good title is enough.
Low, medium or high competition. Each band lists the niches inside it with their revenue, so a low-competition band is not a list of empty markets but a list of markets with room in them.
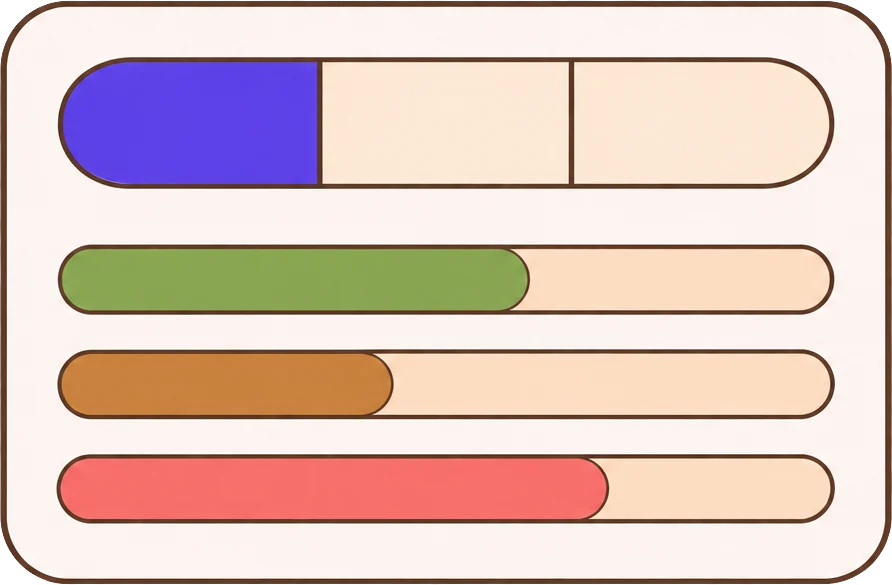
The score is one number, but the reasons differ. A niche can be hard because the head has ten thousand reviews, or because a third of the shelf is paid, or because five sellers hold most of it. The table shows each signal on its own.

The same niche detail as in Category Insights: the products, the sellers who hold them, the price bands. Read who you would be up against before deciding that you are.
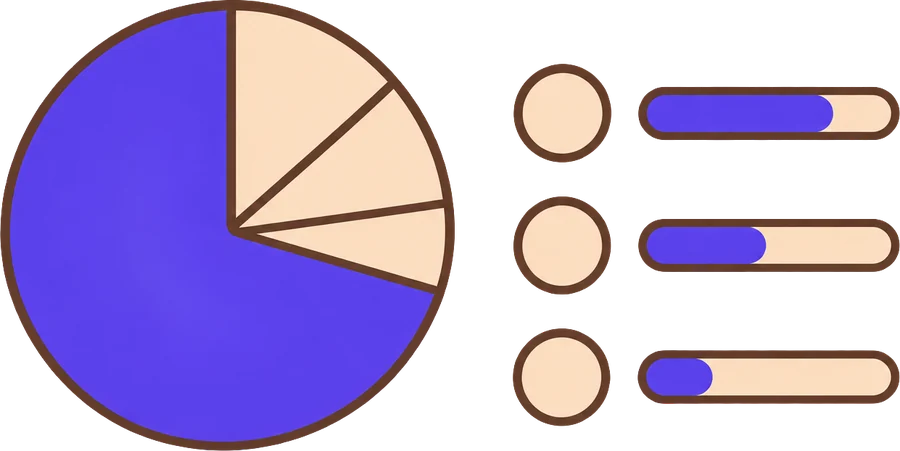
Every figure on the screen has the page it was taken from and the method printed next to it. These are the parts.
The average of three percentiles — offer queue, review strength, paid shelf — with the same 40/60 thresholds in every niche. One number, one meaning, across the product.
How many offers compete on a product card, based on the cards in the listing. A long queue means a buy box to fight for.
The share of sponsored cards on the niche's listing. Marzi measures it per card: the average is 16%, but niches range far around it.
How many reviews the niche leader has accumulated — the moat a newcomer has to cross.
The share of revenue the top five sellers hold. A fragmented market and a captured one can have the same size and very different odds.
Every niche in the index is placed in a band, so a search for “low competition, above 1M zł” is a filter, not a research project.
Marzi says which is which on the screen itself. Here is the short version for Market Intelligence.
Filter the index down to the niches where the head is beatable — then check that the revenue is worth the trouble.
See why your niche feels harder this year: more paid placements, a longer queue, or a head that pulled away.
Map a department by competition to decide where a new line has room and where it will pay for every impression.
The average of three percentiles across the whole index: the length of the queue of offers on a product, the review strength of the niche's head, and the share of paid placements on the listing. Below 40 is low, 40–60 medium, above 60 high.
So that the score means the same thing everywhere. Two hundred reviews is a lot in a small niche and nothing in smartphones; a percentile of the whole index puts both on one scale.
Card by card on the listing: which cards carry the sponsored label, across all cards read. The index-wide average is 16%; the table shows each niche's own share.
The share of the niche's revenue held by its top five sellers. It is computed from the same per-seller revenue the index measures, and it separates a market that is merely big from one that is already taken.
Yes — open the niche and the sellers are ranked inside it, with their revenue and product count. Seller identities are part of the paid layer.
The thresholds are fixed, so a band changes only when the niche's own signals move. History between passes switches on once they are at least 21 days apart.
7 days, no card required. The whole index, your trackers and the MCP endpoint are live from your first sign-in.